Press-Release |
People for Bikes – 2022 City Rankings out for Santa Cruz
People for Bikes, the organization based in Boulder, Colorado, started in 1999 to get more people riding bikes more often and make bike riding better for everyone. They recently published their annual City Ratings, which details how cities across the U.S. stack up on their bicycle networks (physical infrastructure) and community scores (social infrastructure).
The network score is made up of six categories:
- Neighborhoods: access to parts of the city where residents live
- Opportunity: access to jobs and schools
- Essential Services: access to places that serve basic needs, like hospitals and grocery stores
- Recreation: access to recreational amenities like parks and trails
- Retail: Access to major shopping centers
- Transit: Access to major transit hubs
The community score is made up of four categories:
- Awareness: how familiar people are with local biking resources and their city’s efforts to improve biking
- Network: how well a city’s bike network connects people to places they want to go
- Ridership: how often people ride bikes in their city for transportation and recreation
- Safety: how safe people feel riding a bike in their city

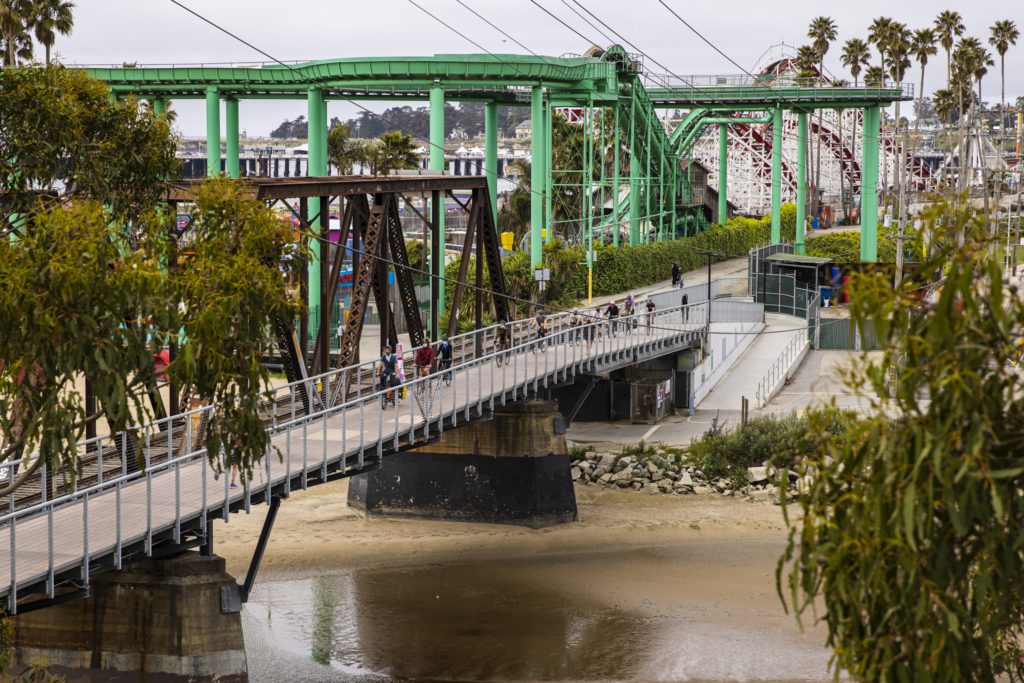
Photo Credit: Josh Becker
These city ratings can provide a helpful rubric to examine various facets of what makes a place bike-friendly. Let’s examine the City of Santa Cruz rankings, in part because it’s the only local city that has both the network score and community score complete, but also because the ratings present a compelling story. For anyone who lives in Scotts Valley, Capitola, or Watsonville, please head to the respective city rating pages and complete the community survey.
What does the City of Santa Cruz rating tell us?
The overall city rating was 31 out of 100. This places Santa Cruz 317 overall out of 1105 cities (71st percentile), and 138 out of 455 for midsize cities (70th percentile). For our bicycle network score, the City of Santa Cruz scored 24 out of 100, just 1 point below the national average of 25. The community score, however, tells a different story. The City of Santa Cruz scored 60 out of 100, where the national average was just 24. Santa Cruz is almost three times the national average! Why would that be when our network score is so low? Part of it comes from the colorful bike culture that is present here.
As my coworker Jordynn Dorado wrote in a great article earlier this year, there is a prolific number of bicycle ingredients in this county from organizations to bike shops, several bike companies, hand-built bike builders, and more that create a bike rich social mosaic. No doubt, this is a major contributor to the City of Santa Cruz’s much higher than average community score.
This disproportionate rating might also explain why Santa Cruz County was just recommended for a historic level of funding from the California Active Transportation Program (ATP).

Photo Credit: Jay Melena
As of October 20, Santa Cruz County received word that it has been recommended for $115M in funding from the California Active Transportation Program for active transportation projects across the county in six different projects. Among the projects, segments 8, 9, 10, and 11 of the rail trail have been recommended for funding. That award represents nearly 11% of overall ATP funding even though Santa Cruz County makes up less than 1% of California’s population. Santa Cruz has already done so much to prepare and ready our community for transformational projects. These projects complete bike networks, build new infrastructure, and connect more people to more places easily by bike.
With such a high community score, and some large-scale projects on the way that will address our lower scoring areas of bike safety and bicycle network, the future for a bicycle accessible and inclusive county is bright!

